Due to some medical circumstances, I produced this project and report by myself rather than as a team like most of the class. I set out to understand how socioeconomic factors and urban development in Montreal, Vancouver, and Calgary are associated with certain patterns of public transit usage while accounting for the limitations of working without a team. Despite some challenges with respect to workload, I was able to overcome these obstacles in order to produce a project and report which are relevant to my career interests in urban planning, sustainability, and transportation planning.
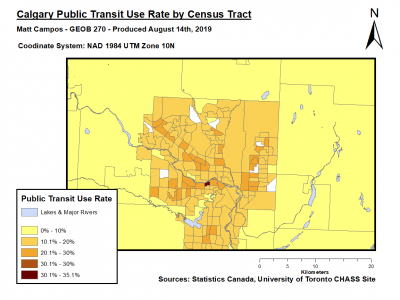
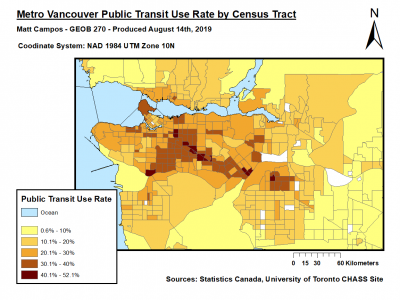
While I found it exciting to execute GIS analysis functions I had less experience in (e.g. field calculations), I was most interested in analyzing the project's results through a holistic lense. As discussed by much of the literature I researched for this project, public transit ridership is affected by a diverse and interconnected set of factors which muddle causation analysis in transit-oriented development. For example, I found it particularly interesting that while elevated public transit ridership spatial correlates with long-distance train corridors (e.g. the Skytrain in Vancouver and CTrain in Calgary), the efficacy of transit-oriented development along these corridors isn't unequivocally supported by planning research. For instance, while mixed-use zoning at sub-centers along the corridor is found to positively impact public transit ridership, gentrification from high-density condominium development at these sub-centers may offset the benefits of transit-oriented development. This study makes it clear that discussions of public ridership census data and urban fabrics/transit networks should not be separated from discussions about regional socioeconomic and population patterns. This project introduced me to a holistic, integrated way of thinking which may be useful in any future courses or work experiences in GIS and city planning.
Here is a link to the project report with my maps, flowcharts, methodology, and discussion about the results:
Urban Fabrics & Transit Ridership
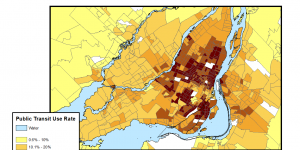
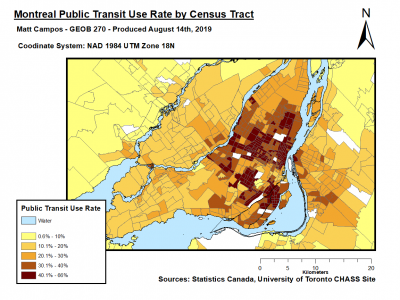
Here are the 3 maps I produced:
(Click to enlarge)


Through independent project management, I refined my skills in time management and developing realistic timelines for a GIS project. In addition, I applied research and social science analysis skills I've acquired as a human geography major to discuss GIS visualization results while making well-founded research and policy recommendations. All in all, I analyzed data from the 2016 Canadian Census through reclassification, layer plus tabular joins, field calculations, and data parsing in order to produce 3 maps which clearly visualize a sustainability challenge faced by many cities in Canada.